Mining Historical Shellfish Sanitation Data
Water quality is a vital metric for monitoring the health of estuarine systems. As it stands, compared to the tens of thousands of freshwater monitoring stations, coastal water quality is only monitored through a couple hundred stations, despite this ecosystems increasing importance. Even in North Carolina there are only 4 dedicated, water quality sampling stations in two designated reserves from the NERRs SWMP. North Carolina’s coastline contains incredible amounts of variation and uniqueness and the current infrastructure in place is not nearly enough to collect the data needed to ensure the persistence of these ecosystems.
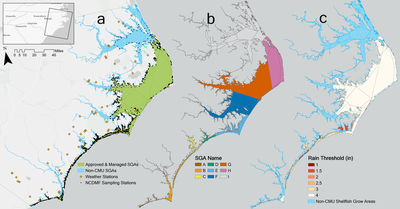
This is where the NC Division of Environmental Quality comes in! NCDEQ manages shellfish growing waters and has been testing the waters to ensure public safety standards are met all the way back since the 1920s. To manage shellfish aquaculture in North Carolina, they split up the coast into smaller subdivisions called shellfish growing areas or SGA’s [[[FIGURE]]]. Each SGA is designated as restricted, approved, or conditionally approved for shellfish harvesting. These area classifications are given based on the results of sanitary surveys. Of the 9,208 km2 of shellfish waters, 5,910 km2 (64.18%) are approved and conditionally approved and will be the areas that this analysis focuses on. Each conditionally managed area is assigned a rainfall threshold from 1 to 4 inches. Basically, because fecal coliform loading in a system is highly connected to runoff, if a storm or rainfall event meets this threshold within a 24 hour period, a growing area will automatically close and can be reopened after water sampling comes back with fecal coliforms at a safe level. These water quality samples that are used to reopen a closed SGA are called conditional samples. Routine sampling is done when SGAs are open to assess the health of an area during good conditions. This must be performed 6 times annually to maintain the SGA classifications. The fact that this has been performed back since the 1920s with a digitized database maintained since the 1970s means that there is incredible potential to use this type of regulatory data to inform general water quality trends.
The project focus was to use this shellfish sanitation data to look at the historical trends in fecal coliforms while also looking at the correlations with trends in other environmental and management variables. This was accomplished with 3 goals in mind: To assess whether we can actually use this monitoring data to infer anything about water quality To analyze the fecal coliform concentrations over space and time And to identify any possible management or environmental relationships to these fecal coliform trends that would indicate drivers of change
This study’s purpose was to utilize shellfish management data to infer long-term trends in water quality parameters, while accounting for variation in routine sampling conditions and environmental landscapes. Specific objectives included: Analyzing spatiotemporal trends from multidecadal fecal coliform concentration observations collected by a shellfish sanitation program Identifying possible management and environmental drivers of fecal coliform trends Assessing the feasibility of using these monitoring data to infer long-term water quality dynamics
Using Mann-Kendall trend testing (a commonly used trend test for environmental data), we calculated Kendall’s tau and Sen’s slopes for each of the stations that had 20 years of continuous data between 1999 and 2021. Kendall’s tau is a statistic between -1 and 1 that describes how monotonic a trend is in a time series. But because this only provides a measure of the strength of the trend and not the rate of change, we calculate Sen’s slope to give us an idea of the magnitude of change in the trends.
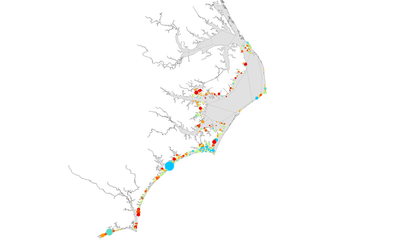
The results of this analysis look like the map above! The water quality sampling stations are colored by their tau value with the red indicating a positive tau value which translates to an increase in fecal coliform concentrations over the past 20 years of sampling. The blue and green indicates a negative tau value meaning a decrease in fecal coliform concentrations over the past 20 years of sampling. The stations are also sized by the magnitude of the sen slope, so larger points are increasing or decreasing at higher rates. The inset map is just there to give you a better look at specific area results in Carteret County.
The next portion of this analysis involves focusing more on the associated trends in environmental drivers. The environmental parameters that we looked at were land use and land cover, salinity, precipitation, and distance to shore, all of which we believe are relevant to fecal coliform dynamics in coastal systems. We created correlation matrices on the full coast scale as well as broke the results down by SGA name which gave us a better look at local patterns in trends. To try and capture these local nuances in the interpretation of fecal coliform trends in relation to their environmental parameters, we chose 3 focal areas to focus in on to get a representative sample of different ecological and maricultural landscapes. We define these areas based on estuary type, rainfall thresholds, developed land change (in purple on the figure), and leasing activity.
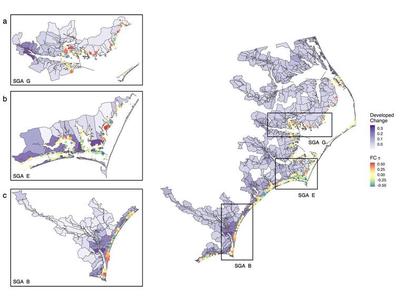
- In area B towards the bottom, there are generally increasing fecal coliform trends in the southern area near the Carolina Beach and Bald Head Island locations whereas there are decreasing fecal coliform trends in the more northern lagoonal areas near the Masonboro Reserve. This area is characterized by the Cape Fear River that carries waters from the highly developed Wilmington area. This relationship between increasing fecal coliform concentrations associated with high intensity development aligns with what we expect from a system like this.
- Focal area E in the center experiences a more mild, but still moderate increase in development; however, this area’s results indicate improving water quality with the negative tau values for the fecal coliform trends over the past 20 years. The management difference between B and E is seen in the rainfall thresholds. B has relatively high rainfall thresholds while E has very low rainfall thresholds. This means that E will close in response to more rainfall events than B. We think that because routine sampling can only occur when areas are open and E will be closed more often than B, that the samples being taken for E are at times where there is higher marine influence and at times that you would expect to get the lowest fecal coliform estimates for that system.
- Focal area G, at the top, is characterized by the very high rainfall thresholds and relatively little developed land use change. We think that this area may be more representative of the system’s water quality dynamics because these samples capture fecal coliform concentrations at a more diverse range of conditions.
So with all of that, the main takeaways from this study were that shellfish sanitation data CAN be used for long-term water quality inference, with lesser concern for sampling bias in areas that are not conditionally managed. But even then, results from conditionally managed areas can demonstrate the effectiveness of current and past management decisions in particular areas. Focal areas B, E, and G, can be used as case studies for interpreting these results in different environmental and management landscapes. And trends in salinity can provide further insight into the management-driven sampling bias from a particular area. Hopefully this study contributes to a better understanding of how we can repurpose this regulatory data for other long-term water quality monitoring analyses.