mk.test: Mann-Kendall Trend Testing in R

Mann-Kendall Testing
The Mann-Kendall test is a non-parametric, rank-based test that is commonly used in environmental sciences to determine whether or not there is a monotonic trend in a timeseries. The assumption that you need to consider before using Mann-Kendall is that there is no seasonality in the dataset (there is a seasonal Kendall test that you can use for timeseries collected over mutliple seasons).
The test statistic is calculated by:
$$ S = \sum_{i = 1}^{n-1} \sum_{j=i+1}^n sign(y_j - y_i) $$
Where the $sign(y_j - y_i)$ is equal to 1 when $y_j > y_i$, 0 when $y_j = y_i$, and -1 when $y_j < y_i$
We then use this statistic to calculate Kendall’s rank coefficient ($\tau$) value:
$$ \tau = \frac{2S}{n(n-1)} $$
This $\tau$ value ranges between -1 and 1. A $\tau$ of 0 indicates no trend whereas a $\tau$ of -1 or 1 indicates a perfectly negative or positive trend respectively.
R package: trend
To implement Mann-Kendall trend testing in R, we are using the trend package. This packages documentation is here and while we are just using the generic Mann-Kendall test, there are also Seasonal, Correlated Seasonal, Multivariate, and Partial Mann-Kendall tests included.
This example we are using the Long term Ecological Research program (LTER) sample datasets that are accessed through the lterdatasampler package in R. More information about this package can be found here.
To get started we will setup out workspace by loading our packages and reading in our data.
# Load packages
    library(trend)
    library(tidyverse)

    library(remotes)
    remotes::install_github("lter/lterdatasampler")
    library(lterdatasampler)
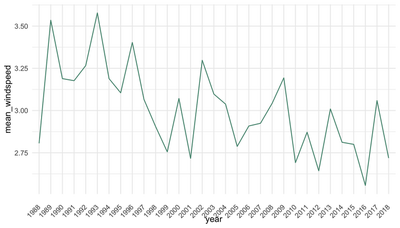
This data that we are working with is from meteorological data from the Toolik Field Station at Toolik Lake, Alaska, from 1988 - 2018. We will specifically be looking at mean windspeed as plotted below:

Because there is seasonality within this dataset, for now, we will aggregate annually:
aggregated <- arc_weather %>%
  mutate(year = format(date, "%Y")) %>%
  group_by(year) %>%
  summarize(avg_wind = mean(mean_windspeed, na.rm=TRUE)) %>%
  ungroup()
The implementation of the Mann-Kendall test itself is very straightforward and requires your data to be in a vector of class “numeric” or a time series object of class “ts”. A majority of the alternative Mann-Kendall tests requires data to strictly be a time series object.
# Mann-Kendall Test
mk.test(aggregated$avg_wind)

################################
# Mann-Kendall trend test
#
# data:  aggregated$avg_wind
# z = -3.4333, n = 31, p-value = 0.0005963
# alternative hypothesis: true S is not equal to 0
# sample estimates:
#            S         varS          tau
# -203.0000000 3461.6666667   -0.4365591
You can see in this output the $\tau$ value of -0.437 which indicates a moderate, monotonic decrease in annual average windspeed over the 31 year time period. This degree of negative monotonicity is significant with the p-value of 0.000596. The limitations of this test in the trend analysis sense is that it does not provide any insight into the magnitude of the trend. This can be informed by Sen’s Slope testing.
We went over the basics of Mann-Kendall trend testing and an application of this test using the trend package in R. Hopefully this provides a starting point to further trend analyses!
Resources
- Thorsten, P. 2020. Non-Parametric Trend Tests and Change-Point Detections. https://cran.r-project.org/web/packages/trend/trend.pdf.
- Donald W. Meals, Jean Spooner, Steven A. Dressing, and Jon B. Harcum.
- Statistical analysis for monotonic trends, Tech Notes 6, November 2011. U.S. Environmental Protection Agency.
- Mann, H. B. 1945. Nonparametric Tests Against Trend. Econometrica 13. [Wiley, Econometric Society]: 245–259. https://doi.org/10.2307/1907187.
- Kendall, M. G. 1975. Rank correlation methods. 4th ed. London: Griffin.