Shifting Sands: Quantifying 8 Years of Changes on Shackleford Banks
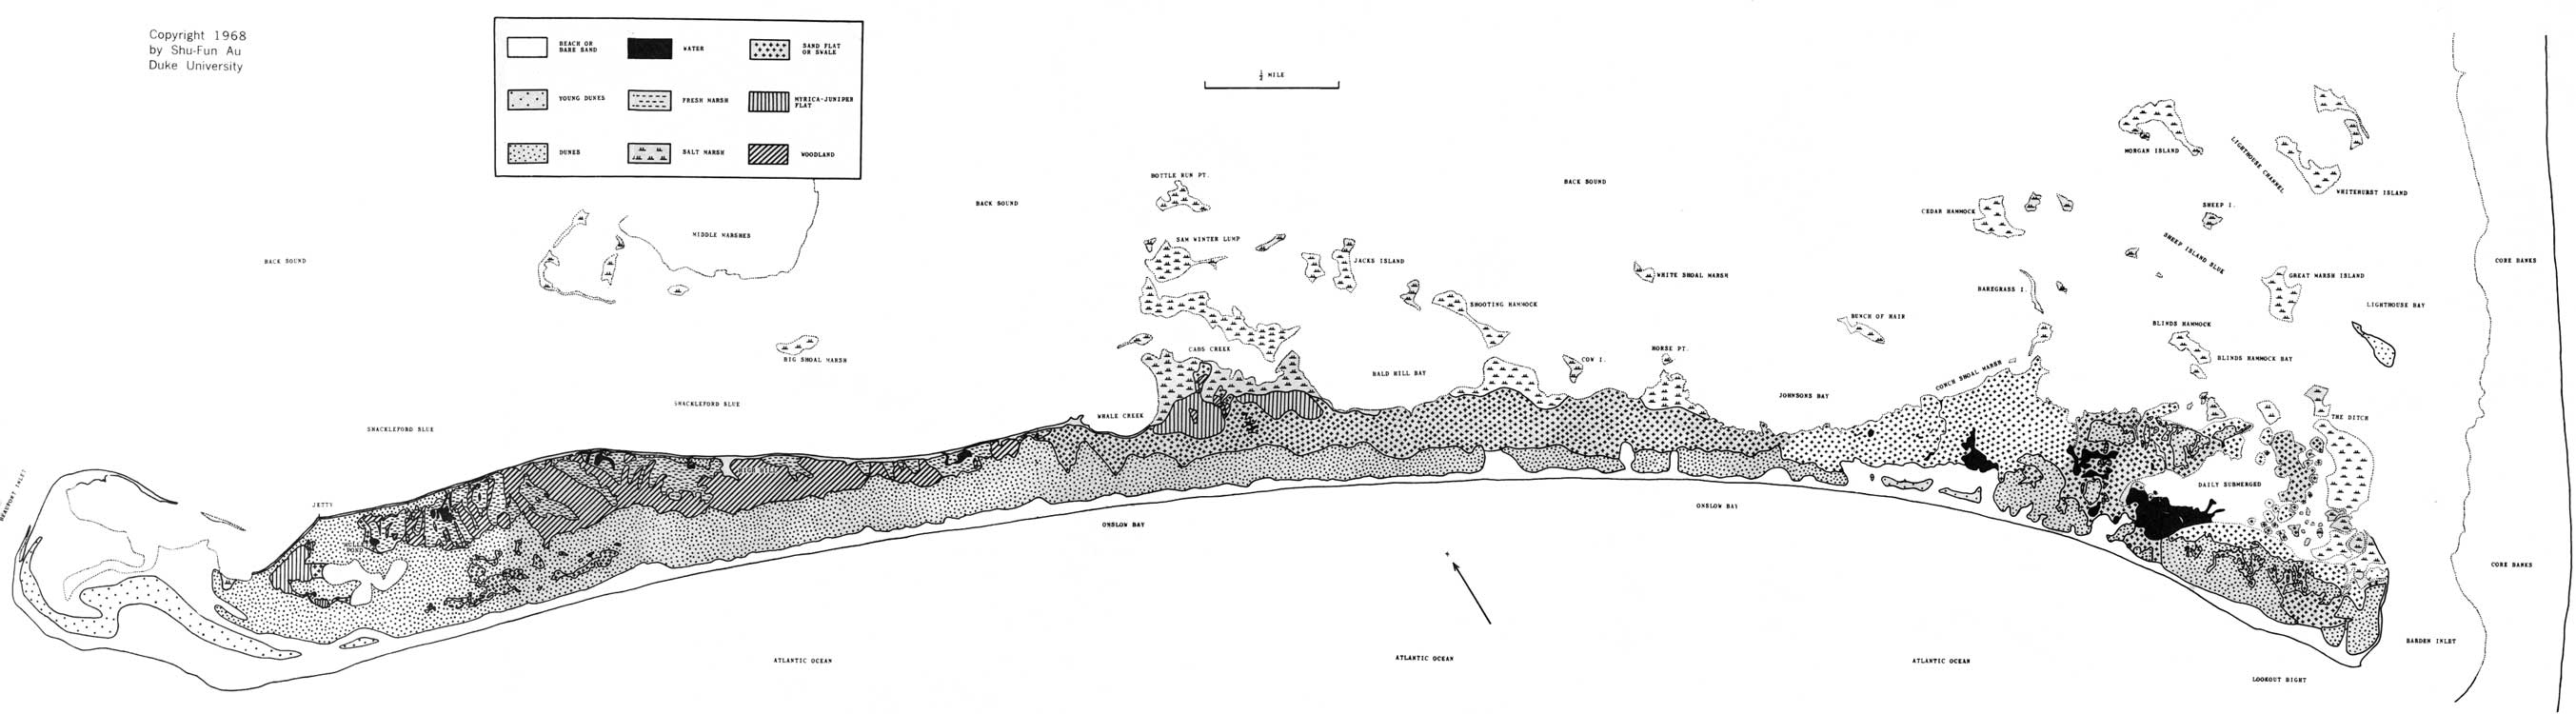 Image credit: Shu-fun Au
North Carolina’s extensive coastal region is protected by a chain of naturally-occurring barrier islands. These areas provide economically important services, protection against disturbance, mitigation of the effects of climate change, and essential habitats for many organisms. Understanding the dynamics of the barrier island habitats and the historical land cover and erosion change is vital if we are to adapt to rapidly changing conditions. I used NCOne Maps imagery in conjunction with NC Department of Public Safety’s Lidar data to (1) delineate barrier island specific habitats, (2) quantify the habitat and volume change on the western end of Shackleford Banks between the years 2012 and 2020. I then used these habitat changes to (3) identify areas that may be vulnerable to future disturbances. It was found that on the western end of Shackleford, there was a total loss of 36,035,426.24 ft3 of terrain above sealevel, with most of the lost habitat classified as sand, grassy dunes, and marshland. This type of analysis can contribute to the understanding of these dynamic landscapes that provide vital ecosystem services to the North Carolina coastal region.
Introduction
Shackleford Banks is a 9 mile long barrier island off the coast of Carteret County in eastern North Carolina. Home to a herd of wild Banker horses, nesting sea turtles, shorebirds, and other wildlife, it is an incredibly important natural area. This area is also a tourist destination, bringing in hundreds of thousands of dollars for neighboring communities during the summer months. With climate change destabilizing many coastal ecosystems, monitoring ecologically and economically valuable areas such as Shackleford Banks will become evermore vital.
Barrier islands protect coastal habitats and communities from the heavy disturbances brought on by the Atlantic ocean. They will also be important for future disturbances such hurricanes, floods, and inlet maintenance. The changes and movement of these islands can affect the resiliency and adaptive capacities of the more inland communities and natural assemblages [1] . Because the changes brought on by disturbance do not affect barrier island habitats the same, it is important to understand the habitat land cover and long term changes in land cover to understand the resiliency of the protective islands [1, 2] . Lidar data is a very powerful tool that can be used for coastal habitat mapping and erosion analysis.
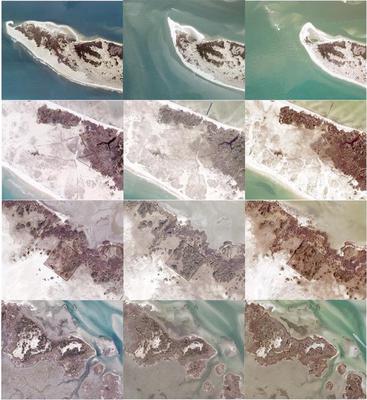
With increasingly available and finer resolution imagery, this kind of environmental monitoring data needs to be processed and interpreted. NCOne Map in particular provides an immense resource for time series imagery over the past decade in North Carolina. Shackleford is a unique area with habitats including maritime forests, mudflats, marshes, high dunes, grassy dunes, and sand flats. As seen in the imagery below, there are many exposed natural and man-made structures that exhibit change over time. For example, in the second row you can see the degradation of the fences historically used to round up horses. The leftmost panel showing the imagery in 2012, the middle panel showing 2016 and the rightmost panel showing 2020 imagery.
Here, I use NCOne Maps imagery in conjunction with NC Department of Public Safety’s Lidar data to (1) delineate barrier island specific habitats and (2) quantify the habitat and volume change along the west end of Shackleford Banks between the years 2012 and 2020.
Methods
All of this work was done in ArcGIS Pro, but the general workflow could potentially be used with a combination of open source software such as QGIS and GRASS.
Image Classification for Habitat Change
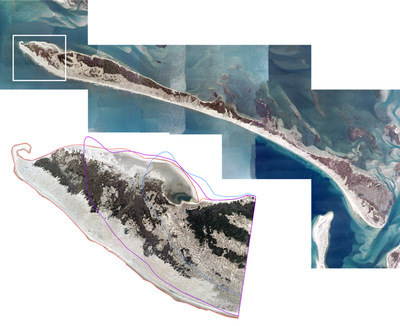
To reduce computational time required for the analysis and to simplify the number of habitat types in the model, I decided to only utilize the west end of the island. This area was chosen as a representative area to develop the programmatic workflow because it is relevant to the Beaufort Inlet hydrology and contains the main tourist drop off points along the island. To prepare the data, I manually created bounds for the western portion of Shackleford Banks with a standardized longitudinal cutoff for each of the orthoimages shown in the white box in the figure below (red boundary is 2012, purple boundary is 2014, blue boundary is 2020).
These were used to clip the orthoimagery for 2020 and 2012 and the 2014 DEM from the Lidar data. To assess the habitats for 2020 and 2012, I created a new classification schema to include sand, marsh, submerged aquatic vegetation, water, grassy flats, maritime forests, and grassy dunes. I created 10 to 11 training samples for each class and used the classify tools to perform supervised image classification for both 2020 and 2012 imagery. I then calculated the areas (in ft2) with the Zonal Geometry as Table tool for each of the habitats. Once this data was exported to spreadsheets, proportions and the differences in land cover classes between 2020 and 2012 were calculated.
Click to view more about imagery acquisition
The NCOne orthoimagery was taken through multiple contractors including Atlas Geographic Data Inc. (who specifically took the imagery for this project), Sanborn Map Company, Spatial Data Consultants, Surdex Corporation, and Quantum Spatial. The type of camera used was a Leica DMC III airborne digital camera and the imagery was taken on 2/22/2020 and 2/23/2020 (focal area was taken on 2/22/2020). The aircraft used was a Cessna 414 owned by Aerodata LLC. The specific metadata for the orthoimagery taken in 2010 was unavailable. The standards set by this program require a minimum snow cover, leaf-off conditions, minimum sun angle (min 33 degrees), and adequate ground control.
Click to view more about imagery properties
The NCOne Imagery has a pixel resolution of 6 inches with an RMSE of 1.0 ft X and Y. This information is accurate for both the 2012 imagery as well as the more recent 2020 imagery.
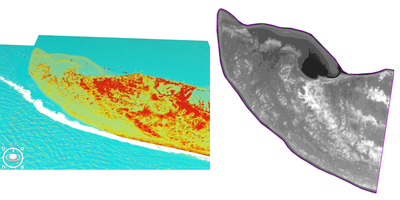
LiDAR for Quantifying Volume Change
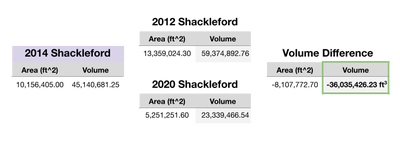
Only Lidar data for this area of NC was available for 2014, which meant that rather than getting direct measurements of volume from the 2012 and 2020 datasets, we will get relative proportions of volume to surface area of the 2014 surface of Shackleford and extrapolate that to get the volumes for the 2012 and 2020 datasets. To do this, I created a DEM from the .las file provided. I used the Surface Volume tool to get the volume of the DEM from sea level.
Click to view more about LiDAR acquisition
The NC Spatial Data Download (SDD) Lidar data was collected by a project with the goal of collecting Lidar data for the entirety of NC. This effort was in collaboration with NC Emergency Management, NC Geodetic Survey, and NC Department of Transportation in response to a need to update older Lidar data as well as to have a highly accurate floodplain map in response to the damage of Hurricane Floyd in 1999. The phase that covered my focal area was completed using a linear aerial sensor. Multiple contractors including the Harris Corporation under ESP Associates were tasked with collecting the Lidar data.
Click to view more about LiDAR data properties
The NC SDD Lidar data for Shackleford was collected in 2014 at a resolution of 2 points per meter with multiple returns and intensity values. There are multiple validation efforts including ground-truthing and quality control for the data. These include independent field surveys, automated density, road, noise, and miss-classification checks, and validation over Wake County. In an effort to reduce misclassifications and noise, all imagery was taken during “leaf-off” conditions.
Results
For the habitat classification, both 2020 and 2012 imagery contained mostly dune grass habitat with sand coming in second. This was expected because of the classification’s tendency to misidentify saturated sand (darker colored sand) as dune grasses. Overall the percentage of tall vegetation increased from 2012 to 2020, likely due to the overall loss of the less stable dune and beach habitats causing the proportion to increase even though there was an overall decrease in land cover.
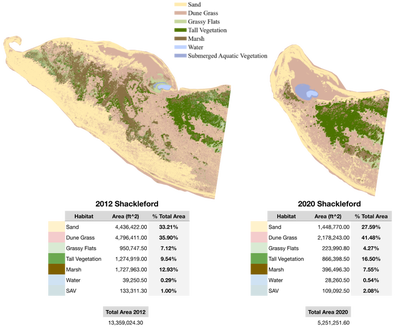
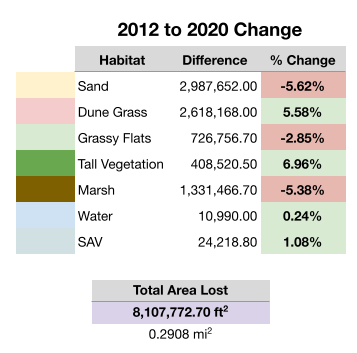
There was a total of 0.2908 mi2 of habitat loss within our focal area, with sand and marsh habitat loss having the greatest negative decline in proportional land cover. The greatest change overall was an increase in the proportion of tall vegetation. This is likely due to the loss of overall western landscape, which was taken up mainly by marsh and sand habitats.
From extrapolating the surface area to volume ratio from the available 2014 Lidar data, I was able to estimate the volume of land in 2012 and 2020. This should be a fairly acceptable method based on the assumption that beach terrain is relatively flat throughout. While there are terrain changes over the entire island, the west end of Shackleford has very simple terrain while areas to the east of the boundary contain the more complex dune terrain. By using these extrapolated values, I calculated the difference in volume between 2020 and 2012 to be a loss of 36,035,426.24 ft3 of terrain.
Discussion
Because I wasn’t able to find much reporting regarding the erosion rates on Shackleford[3], I cannot make any direct comparisons with other studies. However, it is known that coastal engineering projects such as dredging in nearby ports, renourishment projects, breakwaters, seawalls, and jetties can all have effects on flow dynamics and subsequent erosion of nearby islands and beaches[4]. This is likely one of the primary causes of the erosion on Shackleford. The Port of Morehead City increased its port depth from 20 feet in 1861[5] to its current 45 foot depth. Therefore, because the western side of Shackleford acts as the eastern side of the Beaufort Inlet, this significant loss of land due to dredging might be expected.
Future work on this project will firstly address incorporating habitat complexity to improve the machine learning classification of habitats. Once this complexity is incorporated, I will prioritize expanding the application to multiple focal areas on the island so that the full island can be classified. This analytical framework can then be applied to similar outer banks. Once the full island is mapped, a dedicated program to obtain high resolution imagery of the island throughout the year (via drone missions) could be implemented to capture seasonal effects on vegetation and habitat can be incorporated into modeling efforts used for planning purposes. Possible management efforts that can benefit from this type of analysis are controlled burns, managing the horse population, understanding effects of dredging and replenishing beaches, and looking at the impact of visitor density on island dynamics.
Resources
- Hammond, B., and C. Houser. 2014. Quantifying Barrier Island Recovery Following a Hurricane 2014: EP31B-3550.
- Keen, T. R., C. Rowley, and J. Dykes. 2006. Oceanographic Factors and Erosion of the Outer Banks During Hurricane Isabel. NAVAL RESEARCH LAB STENNIS SPACE CENTER MS OCEANOGRAPHY DIV.
- Harvey, A. 2014. Shackleford’s erosion rate focus of geologist’s talk. Carolina Coast Online. https://www.carolinacoastonline.com/news_times/article_0d6dce72-4401-11e4-90ea-53694a084f9c.html. Accessed April 24.
- Hein, C. J., A. R. Fallon, P. Rosen, P. Hoagland, I. Y. Georgiou, D. M. FitzGerald, M. Morris, S. Baker, G. B. Marino, and G. Fitzsimons. 2019. Shoreline Dynamics Along a Developed River Mouth Barrier Island: Multi-Decadal Cycles of Erosion and Event-Driven Mitigation. Frontiers in Earth Science 7.
- History | Morehead City NC. 2022. https://moreheadcitync.org/316/History. Accessed April 24.